Customizing Plot Size in R Markdown
This article explains how to customize plot sizes in R Markdown using chunk options, global settings, the dev.new function, and custom functions. These methods ensure clear, professional, and visually appealing report content.

"Explore our suite of free Markdown toolsto convert, format, and enhance your documents with ease."
R Markdown is a powerful tool for creating dynamic reports and documents that combine code, output, and commentary. One important aspect of creating appealing and readable reports is properly sizing plots. In this article, we’ll explore how to customize plot sizes in R Markdown.
Understanding R Markdown
R Markdown is a file format that allows you to create fully reproducible documents that combine narrative, code, and results. By using R Markdown, you can weave together your R code and documentation, producing reports in various formats, including HTML, PDF, and Word.
Importance of Plot Size
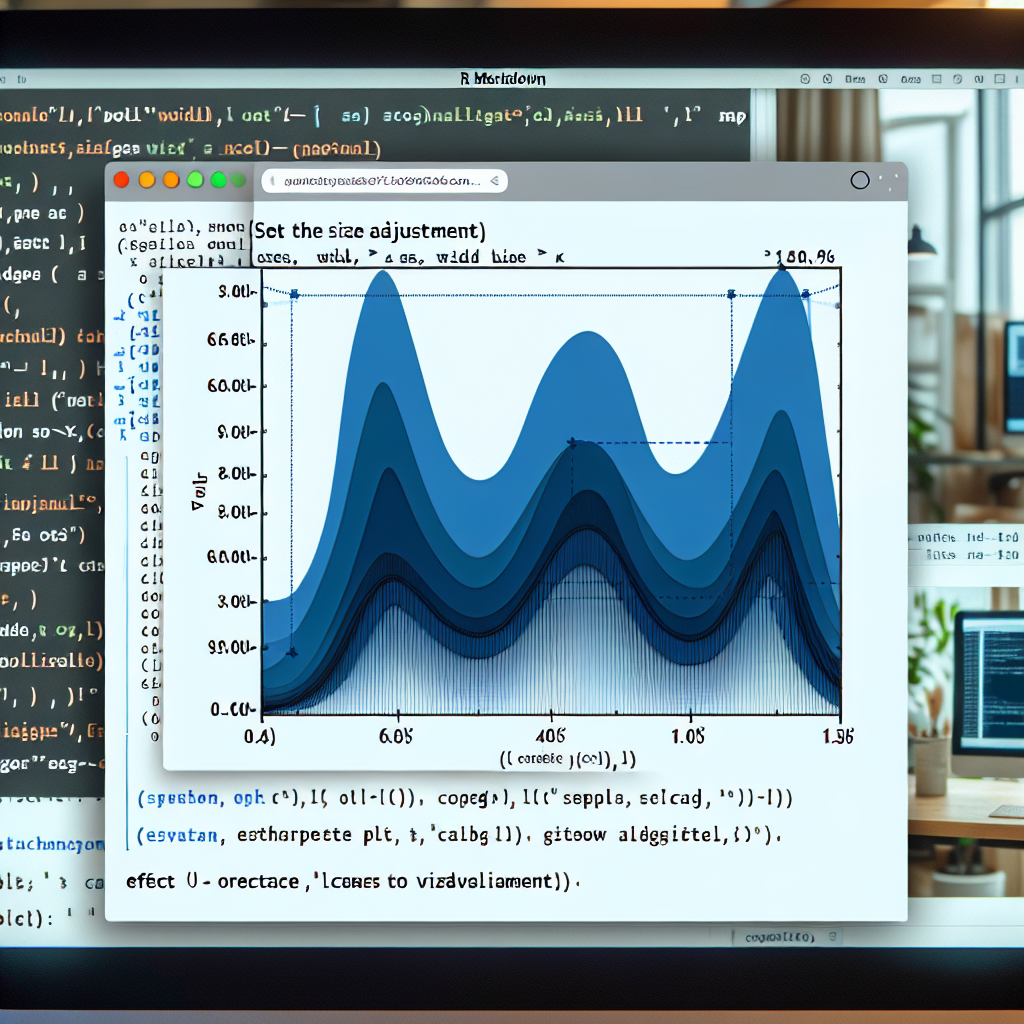
When generating plots in R Markdown, the size of the plots can greatly affect the readability and professionalism of your reports. A plot that is too small might not convey the necessary details, while a plot that is too large can overwhelm the document layout.
Setting Plot Size in R Markdown
There are several ways to customize plot sizes in R Markdown. Here’s a breakdown of the primary methods:
-
Chunk Options:
The most straightforward way to control the size of plots is using chunk options. You can specify
fig.widthandfig.heightwithin the code chunk that generates the plot. Here’s an example:```{r, fig.width=6, fig.height=4} plot(cars)In this example, the plot will have a width of 6 inches and a height of 4 inches. -
Global Settings:
If you prefer to set a default plot size for all plots in your document, you can include global chunk options at the beginning of your R Markdown file. This way, you don't have to specify the size in each chunk:
```{r setup, include=FALSE} knitr::opts_chunk$set(fig.width=7, fig.height=5) -
Using
dev.newFunction:Another way to set the plot size is by using the
dev.newfunction, which opens a new graphics device. This is less common but can be useful in certain scenarios:dev.new(width=6, height=4) plot(cars)Note that this approach is more commonly used in interactive sessions rather than R Markdown documents.
-
Custom Plot Functions:
You can also create custom functions to generate plots with specific sizes. For instance:
create_custom_plot <- function(width, height) {
  par(mfrow=c(1, 1), mar=c(4, 4, 2, 1),
      pin=c(width, height))
  plot(cars)
}

```{r}
create_custom_plot(6, 4)
Adjusting Plot Aspect Ratios
Sometimes, it’s not just the size but the aspect ratio that matters. You can control the aspect ratio by carefully choosing the width and height. For example, if you want a square plot, you might use:
By keeping the width and height equal, you ensure that the plot maintains a square aspect ratio.
Conclusion
Customizing plot sizes in R Markdown is crucial for creating clear and professional reports. By using chunk options, setting global defaults, and applying custom functions, you can control the appearance of your plots to better suit your narrative. With these techniques, you can ensure that your reports are both informative and visually appealing.
If you require any further details or additional examples, feel free to ask!


Comments ()