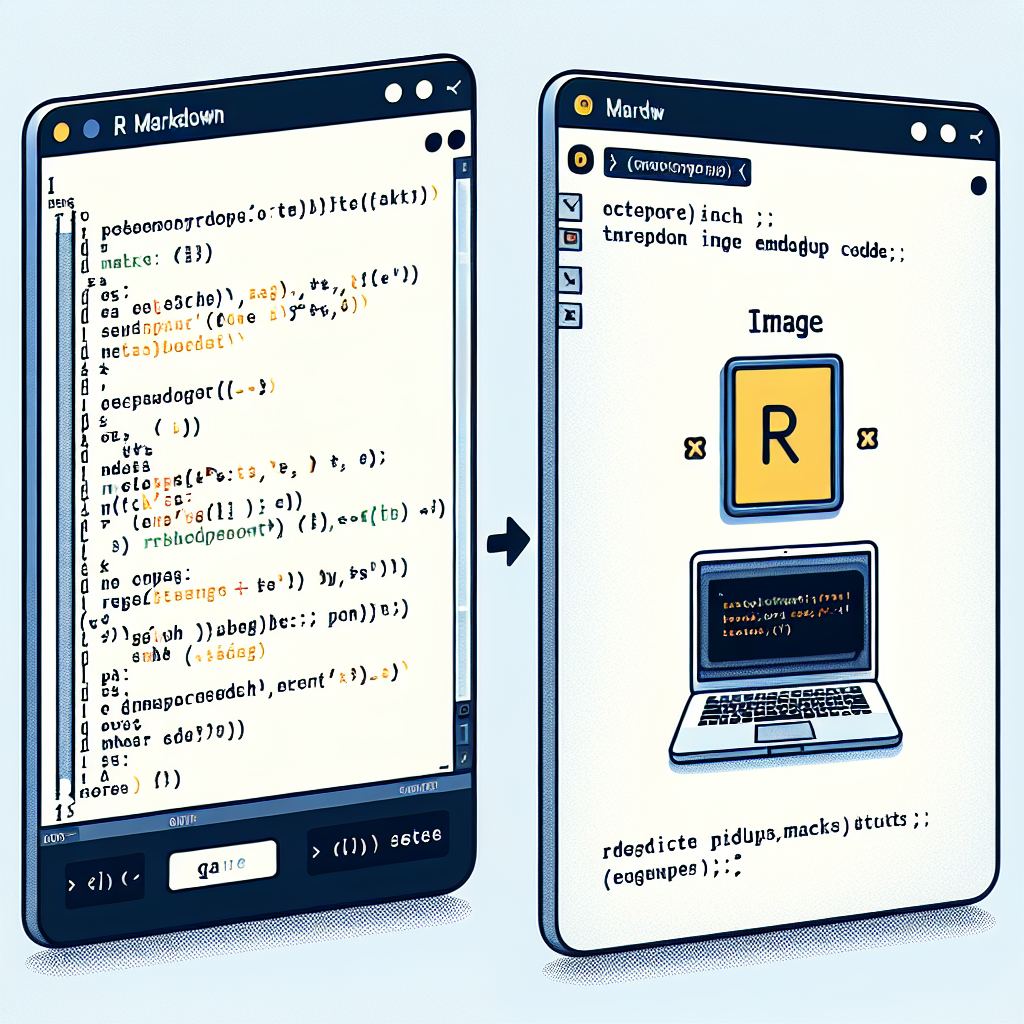
Inserting Images into R Markdown
Inserting images in R Markdown can be done using Markdown syntax, HTML tags, knitr::include_graphics(), or direct R plot code. Use relative paths and organized file structures for better management.
"Need to convert or format Markdown? Check out our free tools– they're easy to use and always available."
R Markdown is a powerful tool for combining text, code, and output in a single document. A common need when creating documents is to insert images. This guide will walk you through different methods to include images in your R Markdown reports.
Method 1: Using Markdown Syntax
The simplest way to insert an image is by using Markdown syntax. This method is straightforward and effective for most use cases.

- Alt Text: This is the text that will show up if the image cannot be displayed.
- path/to/your/image.png: Replace this with the actual path to your image file.
Example:

Method 2: Using HTML Tags
For more control over the image attributes, you can use HTML tags within your R Markdown document.
<img src="path/to/your/image.png" alt="Alt Text" width="500" height="300">
- src: The path to your image.
- alt: Alternative text for the image.
- width and height: Control the dimensions of the image.
Example:
<img src="images/my_image.png" alt="My Image" width="500" height="300">
Method 3: Using knitr::include_graphics()
For inserting images within R code chunks, knitr::include_graphics() is a handy function. This method is particularly useful for dynamic reports.
```{r}
knitr::include_graphics("path/to/your/image.png")
Example:
```{r}
knitr::include_graphics("images/my_image.png")
Method 4: Using ggplot2 or Other Plotting Libraries
If you are generating plots within R, you can directly embed them in your R Markdown document using standard plotting functions.
Example:
```{r}
library(ggplot2)
ggplot(data = mtcars, aes(x = wt, y = mpg)) + geom_point()
This will generate a plot and insert it into your document automatically.
Tips for Managing Image Paths
-
Relative Paths: Use relative paths to refer to images. This makes your R Markdown document more portable.
Example:
 -
Project Directory: Organize your files in a structured manner within your project directory. Create a folder for images and reference them accordingly.
Example:
 -
Check Image Paths: Ensure that the paths are correct by previewing your document before finalizing.
Conclusion
Inserting images into R Markdown is a versatile and essential skill for creating rich, informative documents. Whether you prefer Markdown syntax, HTML tags, knitr::include_graphics(), or embedding plots, R Markdown supports a variety of methods to fit different needs. Choose the method that best suits your requisites and enhances your document’s readability and visual appeal.
Comments ()