Understanding Figure Size in R Markdown
In R Markdown, you can control figure sizes by setting chunk options like fig.width and fig.height. Use fig.retina to adjust resolution, and set global options for default sizes to ensure visual quality and professionalism.
"Explore our suite of free Markdown toolsto convert, format, and enhance your documents with ease."
Introduction
R Markdown is a versatile tool that integrates data analysis and reporting by combining code, text, and visual outputs into a single, dynamically generated document. One of the key features of R Markdown is its ability to include figures, which are often essential for data visualization. In this article, we will explore how to control and customize figure sizes in R Markdown, ensuring that your visualizations are both clear and professional.
Setting Figure Size
In R Markdown, figure dimensions are controlled using chunk options. The most commonly used options for this purpose are fig.width and fig.height. These options specify the width and height of the figure in inches.
Example
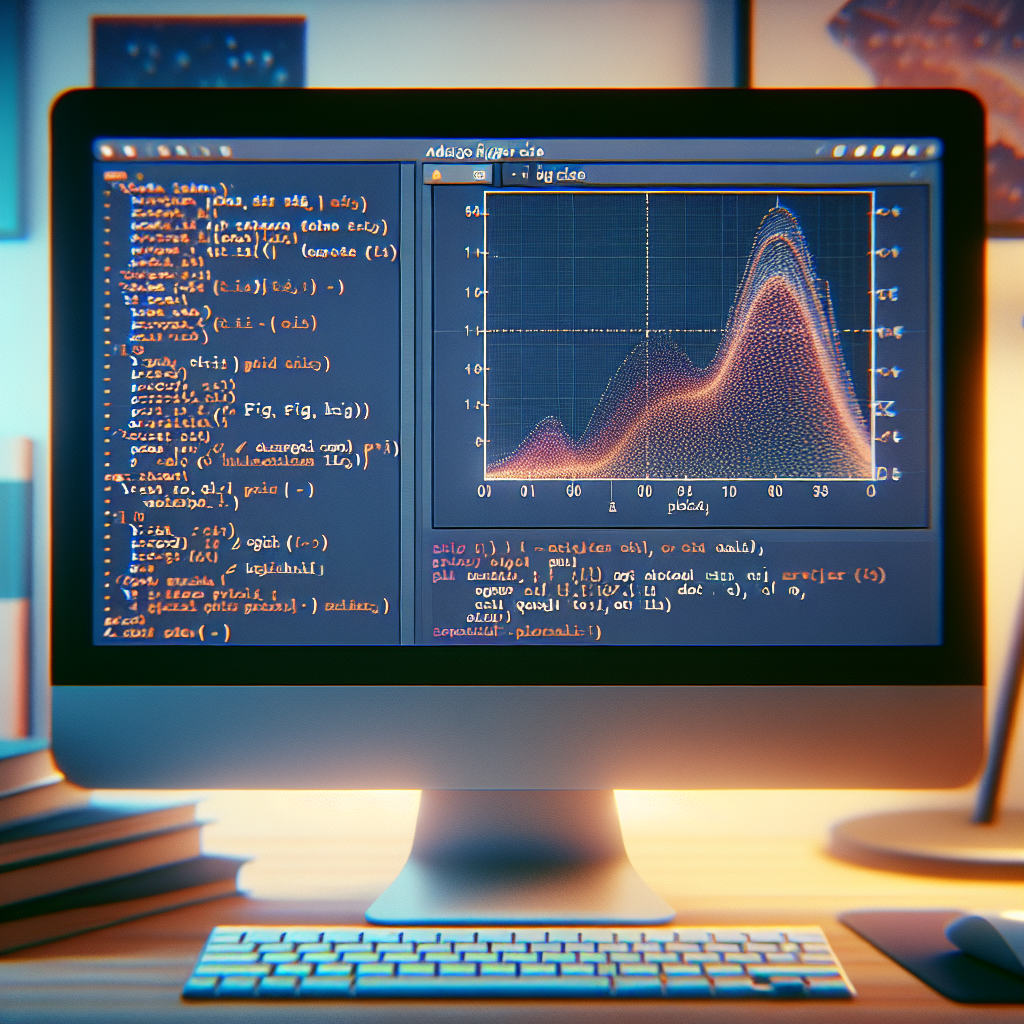
Here is an example of how to set the figure size in a code chunk:
Example plot
plot(cars)
In this example, the plot will be 6 inches wide and 4 inches high.
Controlling the Aspect Ratio
Setting both fig.width and fig.height allows you to control the aspect ratio of the figure. This can be important for making sure your visualizations look correct and are easy to interpret.
Example
To create a plot with a 4:3 aspect ratio, you could use the following settings:
```{r, fig.width=8, fig.height=6}
# Example plot with 4:3 aspect ratio
plot(mtcars$wt, mtcars$mpg)
## Scaling Figures

In addition to setting the absolute size of figures with `fig.width` and `fig.height`, you can also scale figures using the `fig.retina` option, which controls the resolution of the figures for high-DPI displays.

### Example

```markdown
```{r, fig.width=6, fig.height=4, fig.retina=2}
# High-resolution plot
plot(cars)
In this example, the plot will be displayed at twice the default resolution, making it crisper on high-DPI screens.

## Customizing Size for Different Output Formats

R Markdown supports various output formats, including HTML, PDF, and Word. You can set figure sizes differently for each format using the `output` argument in the chunk options.

### Example

```markdown
```{r, fig.width=6, fig.height=4, out.width="80%", fig.retina=2, fig.align="center", dev="pdf"}
# Plot customized for different output formats
plot(cars)
In this example, the `out.width` is set to `80%`, which means the figure will take up 80% of the page width. The `dev="pdf"` option specifies that the figure should be generated in PDF format.

## Default Figure Size

You can also set default figure sizes for all chunks by modifying the global chunk options. This is done by adding a setup chunk at the beginning of your document.

### Example

```markdown
```{r setup, include=FALSE}
knitr::opts_chunk$set(fig.width=6, fig.height=4)
This will apply the specified figure dimensions to all subsequent code chunks unless overridden by individual chunk options.

## Conclusion

Customizing figure sizes in R Markdown is a key aspect of creating effective and professional reports. By understanding and utilizing options like `fig.width`, `fig.height`, `fig.retina`, and others, you can ensure that your visualizations are clear, appropriately scaled, and well-suited to your output format. This not only enhances the readability of your documents but also helps in better communicating your data insights.
Comments ()